Here’s the thing about data. You can shape it into anything.
The great sin, of course, is to shape the data into nothing, to gather up the disparate numbers and pile them onto a page. “Here,” you say as you brush the serif edges from your hands and let them all tumble together. “Have some data.”
So you don’t do that. You wave your hands and swirl the data around into meaningful shapes and you create a story.
And therein lies the thing. The rub. The conundrum. What story will you create?
A true one, you say. Numbers don’t lie. Numbers are binary. Black and white. Concrete.
Only you know none of those things are true.
What you do know is this: there is meaning behind the numbers. You just have to find it.
The Stories in Search Data
I spend a lot of my time looking at search data. When companies tell me how well their sites are performing in search engines, they talk about rankings, and maybe how much traffic they get from search.
Great. You can’t connect with audiences through search engines if your site doesn’t rank for anything and ranking is meaningless if it doesn’t result in site traffic. But if you’re just reporting rankings and traffic, you’re piling numbers on a page. You’re missing the story.
The magic of search data is that the numbers represent words: the literal questions and hopes and fears and needs of your audience. Your audience types what they want right into the search box and hope they feel lucky.
So your site is getting traffic from search engines. So what? Is it all waylaid souls, looking for Taylor Swift song lyrics and not your “Swift Bowling Alley and Arcade Fun Complex”?
What are the stories?
First, let’s check the foundation. How diversified is the traffic? Getting 98% of traffic from (unpaid) search engines might sound great to the search engine optimization team, but it’s not solid ground. Search engine algorithms change all the time, resulting in normal fluctuations that cause traffic to come and go. Unpaid search traffic is definitely vital (everyone searches) but it shouldn’t be all consuming.
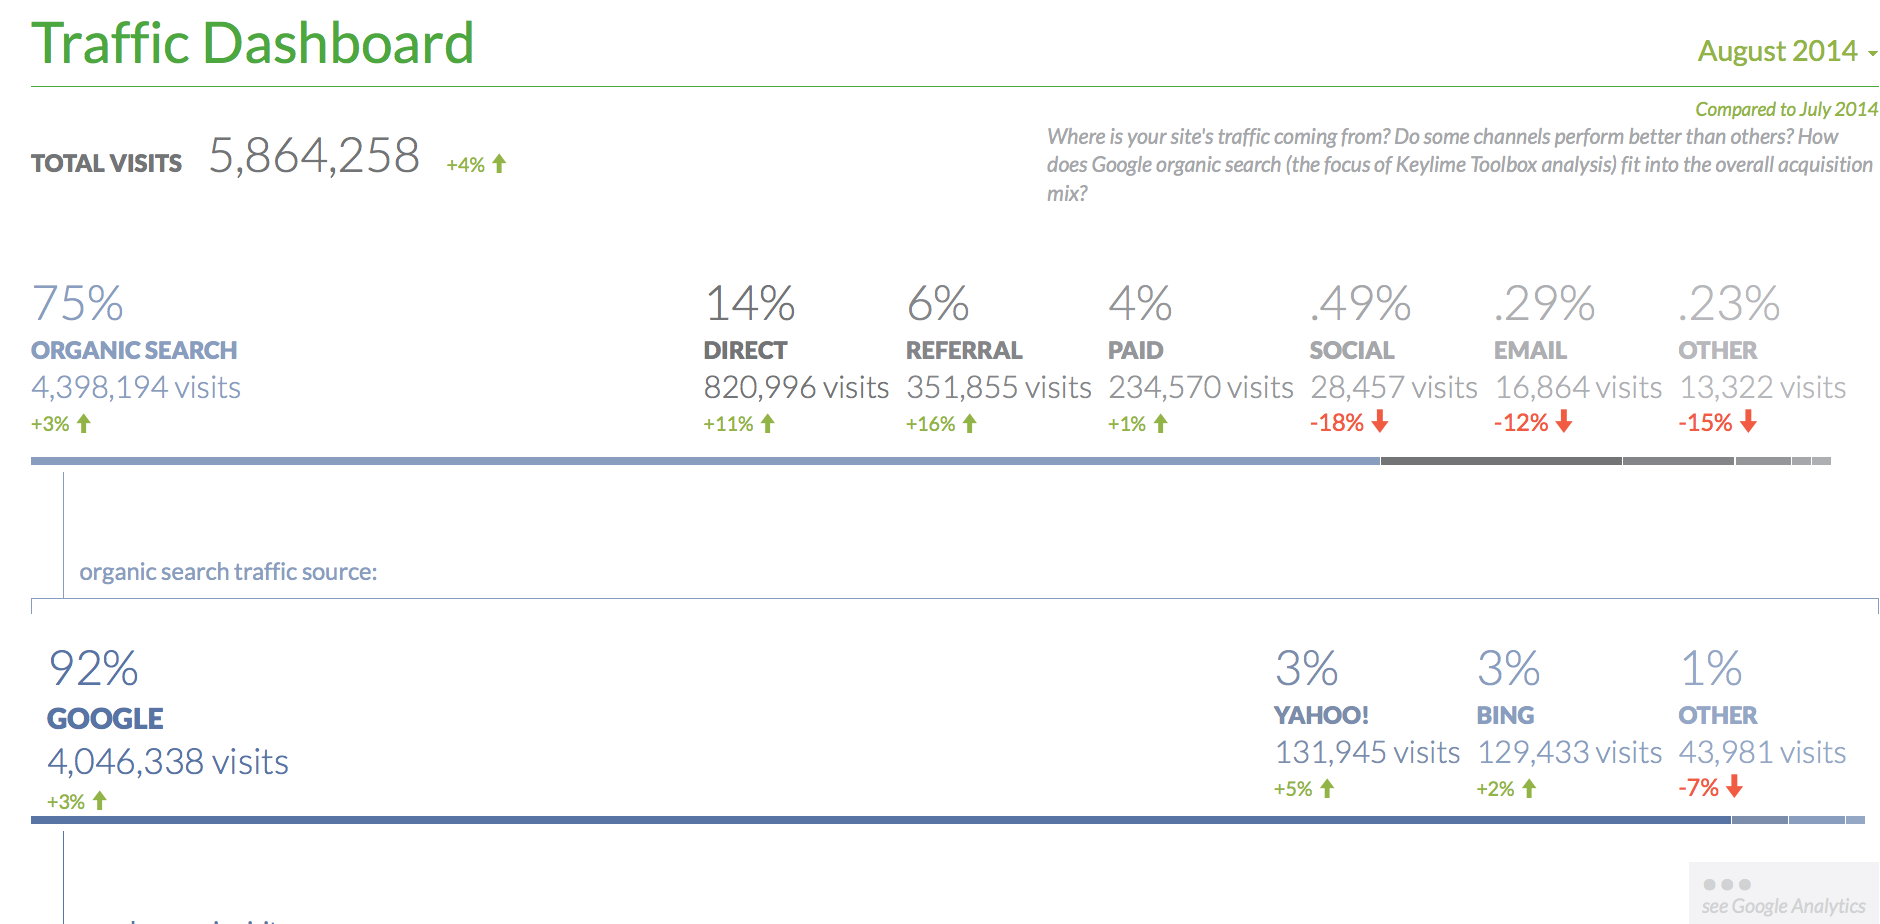
[A high level view of traffic distribution]
But what is your audience searching for? Here’s where the story gets really interesting. It’s the part with all the plot, the conflict, the motivations, the regrets. The part where we find out that we all told the focus group leader we wanted more styles of tailored pants, but deep down, all we wanted was comfier pajamas.
Is all your site’s search traffic from branded searches (variations of searches for your brand)? Then you aren’t showing up for what they’re actually looking for (like those comfy pajamas). Is none of your site’s search traffic from branded searches? Then you have some brand awareness work to do.


[A Tale of Two Sites: One With No Branded Search Traffic, the Other With Nearly All Branded Search Traffic]
The next layer of the story digs deeper. Just what people searching for other than your brand name? Are you making those visitors happy?
By rolling up the queries into segments, you can learn a little more. Like about how we’re all searching for comfy and cute pajamas.
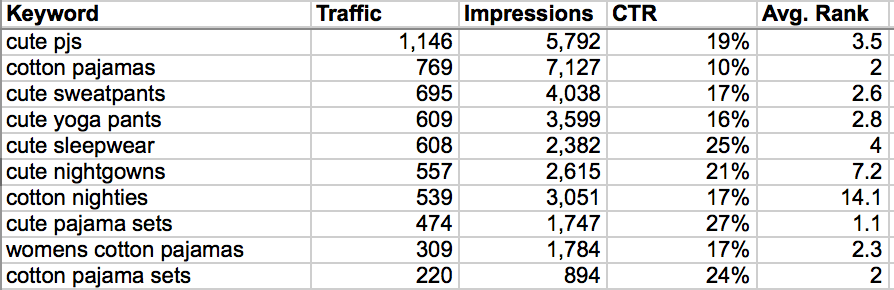
[Our Searches For Pajamas]
Gather all the related data about segments and compare them to get an even deeper story of your audience and how well your site is actually performing. Below, we see that the site attracts considerably more people looking for those pajamas, and it does a better job of engaging them (with a 20% bounce rate vs. a 55% bounce for those looking for the not-as-comfortable dress pants).
[Percentage of Search Traffic and Related Ranking and Bounce Rate Data By Query Segment]
Ideally, you want to take this story all the way to happily ever after:
- 25,000 people a month search for some variation of comfy pajamas.
- We rank an average of second position for those types of searches, with an average click through rate of 20%.
- So we get about 5,000 visitors a month to the site looking for comfy pajamas.
- 50% of those visitors bounce, leaving 2,500 of them engaged with the site.
- 2% of them convert, leading to 100 purchases.
- 5% of them sign up for the newsletter, leading to 250 new email addresses.
And:
Many analytics reports skip this part of the story entirely. Search traffic is going up, they might report, the conversion rate is 1%, tumbling those numbers into a messy pile.
And yet metrics like bounce and conversion can be crazy different from branded vs. non-branded search traffic, and differences in behavior for different topics can give you great insight into what’s working and what’s not.
But it’s understandable. A big part of writer’s block for this story is “not provided”. Google’s secure search means that instead of knowing that our audience really likes comfy pajamas, we just see this:

Well, bummer.
So uncovering the meaning – the people – behind the numbers is harder. But it’s not impossible.
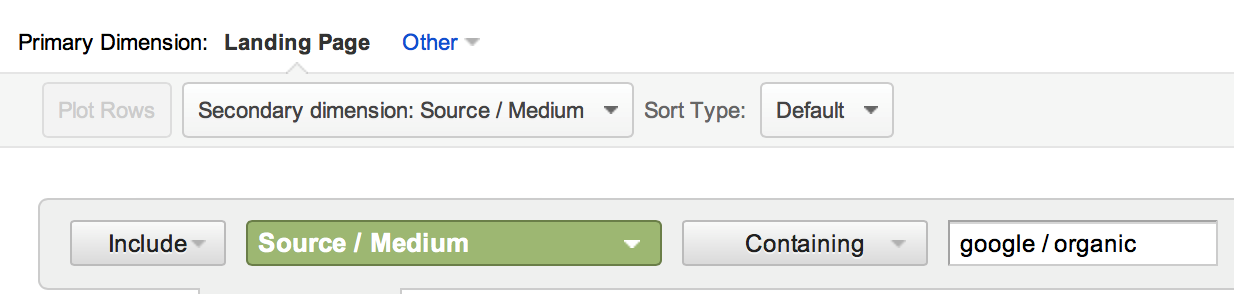
Option 1: URL-Based Analytics
In a pinch you can use the pages searchers landed on as a proxy for what they wanted and can follow the visitor behavior all the way through from engagement to conversion. (In Google Analytics, you can get to this from the Landing Page report, segmented by a secondary dimension of a medium of organic (or source / medium of google / organic if you’re looking specifically at Google traffic).
You can join this data with the Google Webmaster Tools Top URLs report (Search Queries > Top Pages) to get average ranking and click through rate details.
This method lets you do analysis by topic or by page type, but the downside is that you can’t know if a page has really high bounce because it’s not satisfying searcher needs for those comfy pajamas if it’s just ranking yoga pants instead and not even being seen by the right audience.
And the Google average ranking data is sub-optimal at best. If the page ranks highly for a bunch of relevant queries, and then poorly for a bunch of not at all relevant queries, you’ll see a pretty useless overall average ranking for that page.
(You can spot check what queries the pages are getting traffic for using the Google Webmaster Tools user interface, which lets you drill into the queries that brought traffic to that URL, but since the granular query to URL mapping data is not available in either the downloadable CSV or API, it’s impossible to use at scale.)
Option 2: Use Bing and Yahoo Query Data
Only Google query data is “not provided”. You still get 100% of queries from Bing and Yahoo. The downside is that Google often accounts for 70%-90% of search traffic for sites so you may not have much data to work with. But at least you can use this method in conjunction with option 1 to see what queries are bringing visitors to pages.
Option 3: Use Google Webmaster Tools Query Data
Google Webmaster Tools query data comes from Google’s search logs, so it doesn’t suffer from the “not provided” problem. There’s lots of upside here chiefly around the availability of queries not accessible anywhere else, plus great data around the search results page – where your site ranks for each query, the average click through rate, and so on.
But there are downsides to this method too. Not all queries are provided, just the “top” queries. And you can’t get related on site behavioral data at all.
You can at least partially overcome the “top” queries issue by adding subfolders, since you’ll get top queries for those as well, although those reports will have overlap with the reports in folders above them (and the root domain reports).
And you can join the query data you get from these reports with the query data available in web analytics, particularly if you aggregate to the topic level (or least segment branded and non-branded).
This process is basically what I’m doing with my software, Keylime Toolbox. Keylime Toolbox pulls query data from multiple subfolders in Google webmaster tools, aggregates and de-duplicates that data, integrates Google Analytics data, then generates reports on query segments (branded vs. non-branded, comfy PJs, and so on) to better uncover the hidden stories in the data.
Sometimes the job of web analyst is more like an archeologist, uncovering hidden fossils with secrets of those now gone. But if you can get to that fossil, oh the stories it can tell.
Vanessa Fox is the author of Marketing in the Age of Google, a blueprint for using search data for better audience analysis, and the founder of Keylime Toolbox, software that uncovers the stories behind a site’s search traffic. Keylime Toolbox is available for 70% off to DAA members (which brings the cost down to about $90/month for a single site) with promo code DAADC. You can learn more at www.keylimetoolbox.com and you can follow Vanessa on Twitter at @vanessafox.